we Host, you rock!
book your next
party with us!
Need the perfect space for your special event?
Your search is over.
Need the perfect space for your special event?
Your search is over.
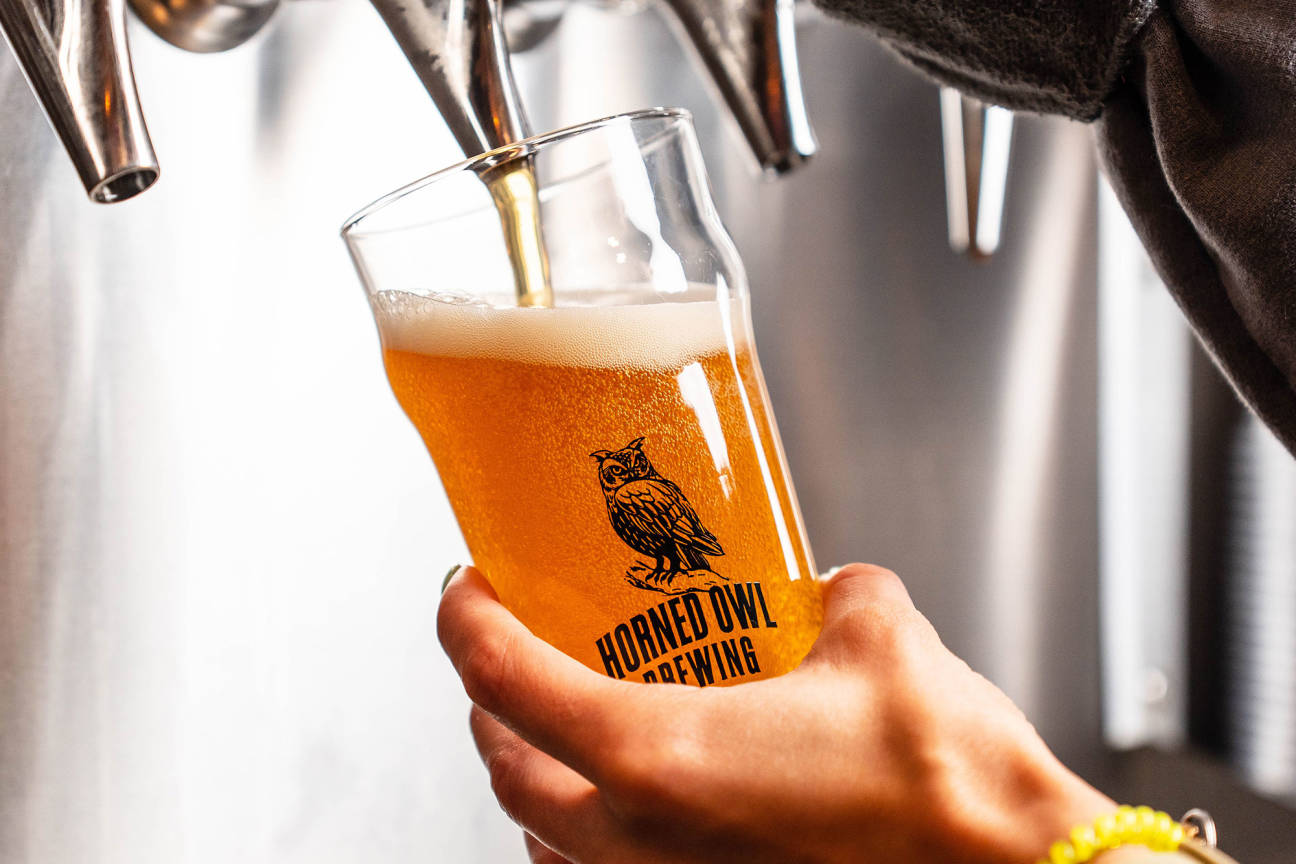
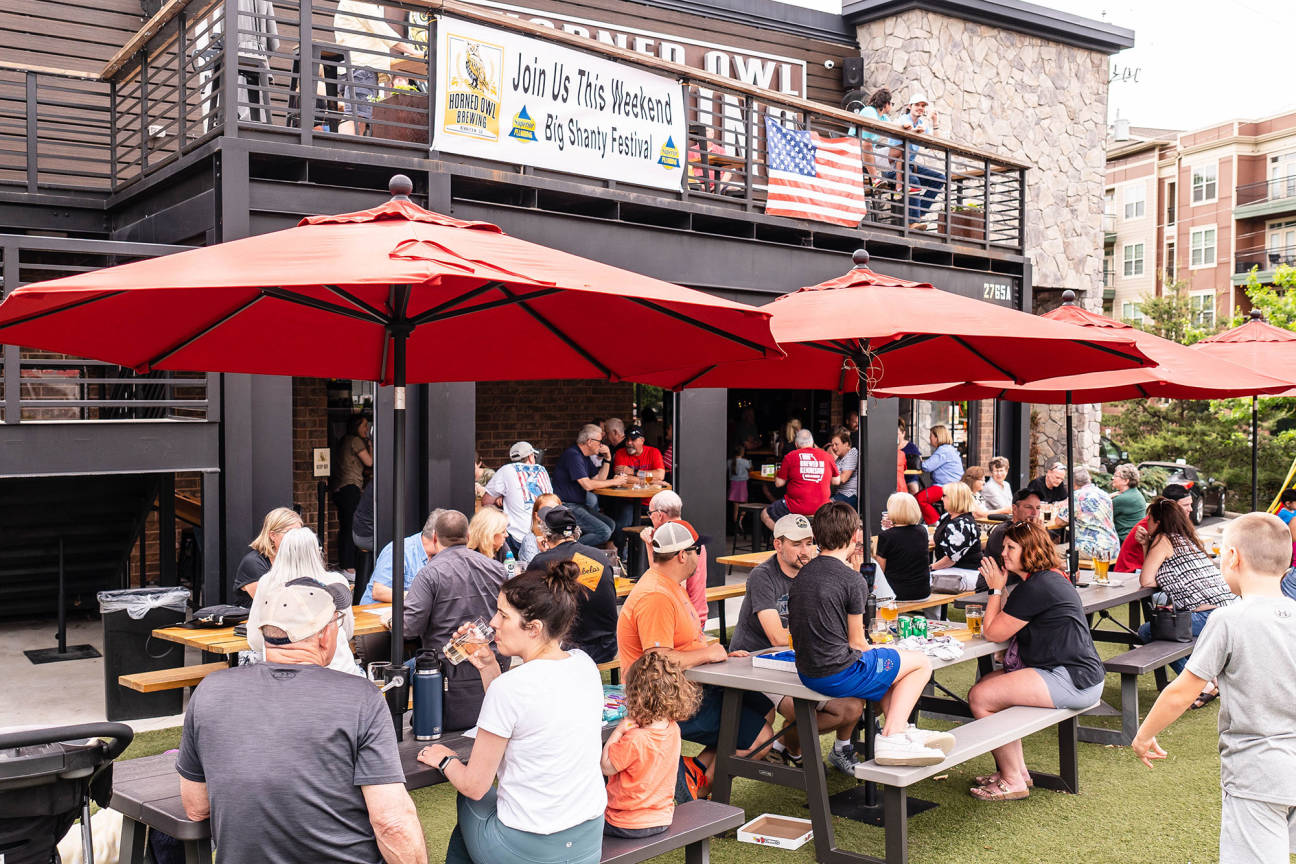
Our small 2600 square-foot taproom is located in Downtown Kennesaw, right in the heart of the entertainment district. It features an outdoor patio, bar games, great music, and a place to hang out with your people.
All the staff was very friendly and attentive. This was our first time going. We really enjoyed the drinks. The snacks were good and so was the live music. Very nice relaxing atmosphere. Will definitely return.
Really enjoyed our visit to the Horned Owl. Tried multiple beers in a flight and enjoyed them all. Grabbed food to go from the nearby Jamaican restaurant and had a really nice lunch. Will stop again when we are back in town. Staff was very friendly and helpful. Made you feel welcome in Kennesaw. Cheers!
This is a must try if you're anywhere in the greater Atlanta area. They're located in Kennesaw but easily accessible from the interstate. Absolutely fantastic, outgoing staff that takes pride in their beer and their business. They made us feel like we were regulars the first time there and family the second time...
Great beer and it's even better when they have lube music and food trucks. Such a cool place to hang out and listen to some local talent!
I love this place. Great beer and good atmosphere. At this point, I been there more times than I can count. Go there. Grab a beer. Sit outside with friends.